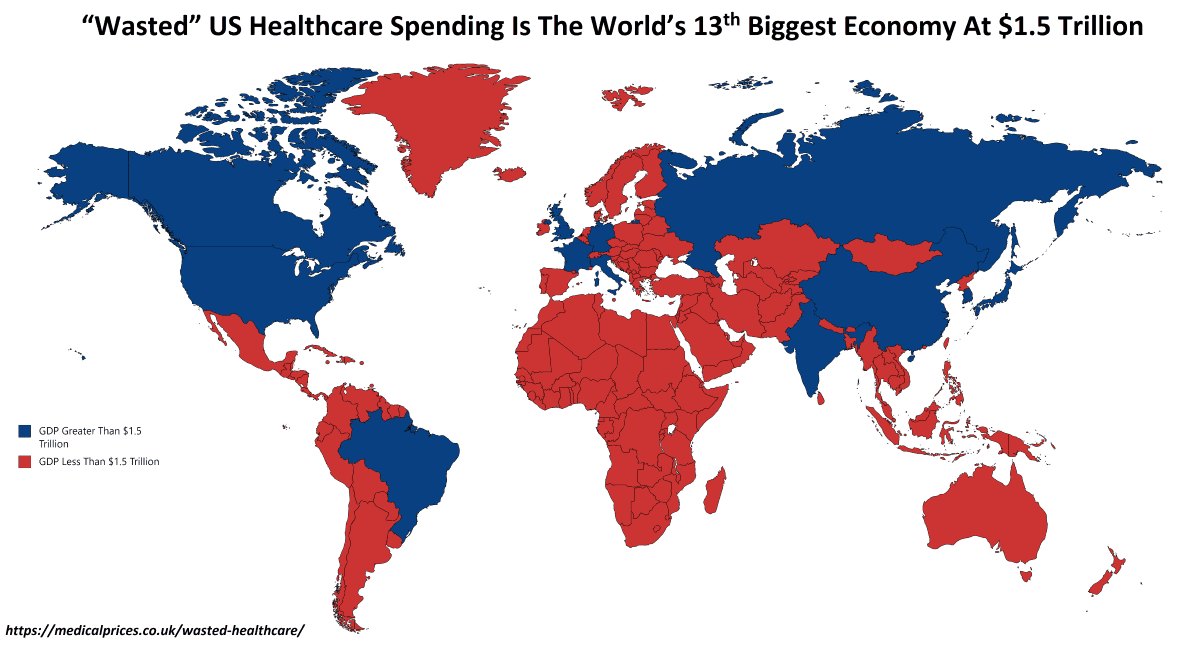
The map below divides the world between countries with economies that are larger or smaller than $1.5 trillion, the amount the US “wastes” on healthcare each year. Only 12 countries have economies above $1.5 trillion, which means “wasted” US healthcare spending would be the world’s 13th biggest economy, just ahead of Spain and Australia.
The methodology is outlined below including most importantly how “waste” is defined.
Data & Methodology
According to the World Bank the US spends by far the most on healthcare per capita (public and private combined) at $9,869.74 annually ($PPP; 2016), well ahead of number 2 Switzerland at $7,867.39.
For reference world average healthcare spending per capita (in $PPP) is just $1,355.61, which means the US spends over 7X the world average.
One way looking at waste would be to compare how much more the US spends above the world average which equals $8,514.13 ($9,869.74 – $7,867.39) per person or about $2.8 trillion. However, this is pretty unsatisfactory because the US has better than average world health outcomes.
According to the World Health Organization in 2015, the US currently ranks 31st in terms of overall life expectancy (men and women combined) at 79.3 years (81.6 years for women and 76.9 years for men). However, every other country with better life expectancy, except Costa Rica ($1,248.55), spends more than $1,355.61 per capita on healthcare.
However, if we look at current health expenditure as a percentage of GDP, we find something a little more interesting.
Again according to the World Bank, US spending at 17.07% of GDP is second only to the Marshall Islands (23.29% of GDP) in terms of the share of the economy devoted to healthcare.
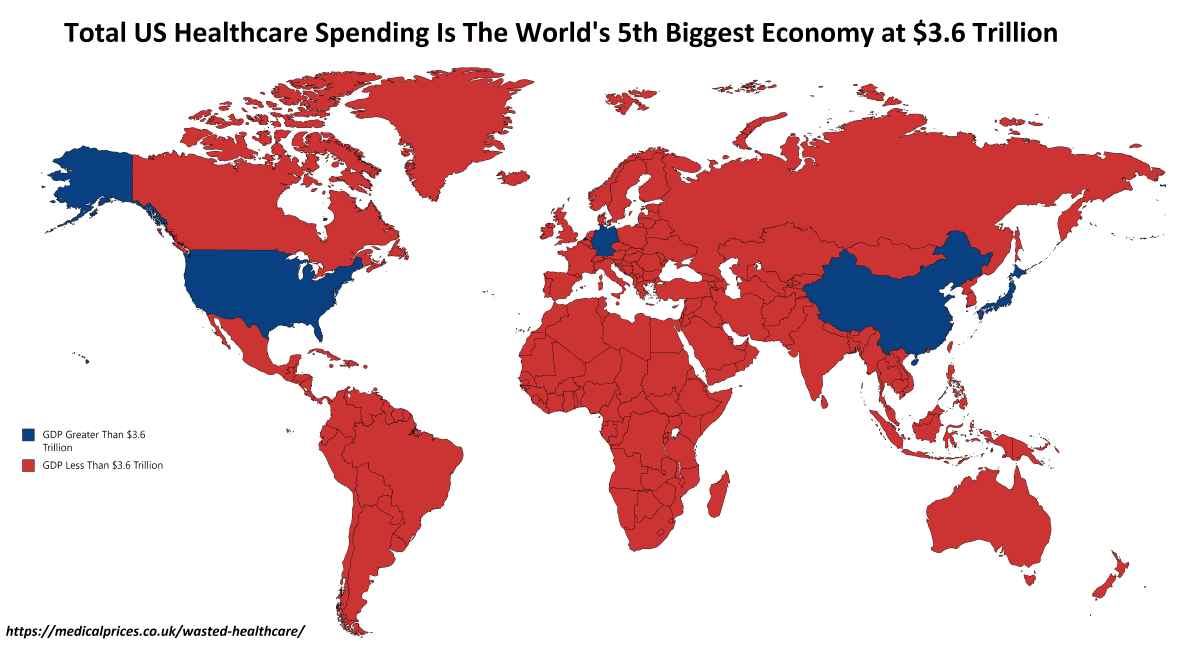
Thus, total US healthcare spending is around $3.6 trillion using current 2019 GDP figures from the IMF (17.07% of $21.3 trillion).
This means total US healthcare spending would be the world’s 5th biggest economy, ahead of India with a population 1.3 billion people. Only the US, China, Japan and Germany have larger economies.
How is “wasted” healthcare spending defined?
So how did we arrive at $1.5 trillion being “wasted?”
The current world average health expenditure as percentage of GDP is 10.02% (which it should be noted includes US spending which brings the average up).
Therefore, we’ve defined “waste” as the difference between what the US spends (17.07% of GDP) and the world average (10.02%) to get a figure of 7.05% of GDP, which works out to roughly $1.5 trillion using 2019 IMF GDP figures.
This is larger than the GDP of Spain or Australia ($1.4 trillion each) or the entire GDP of Indonesia (population 268 million).
However, is this a fair measure?
Well let’s look at the 30 countries with a higher life expectancy than the US and the percentage of GDP they devote to healthcare spending (countries in bold spend below world average).
- Japan – 83.7 years; 10.93% of GDP
- Switzerland – 83.4 years; 12.25% of GDP
- Singapore – 83.1 years; 4.47% of GDP
- Australia – 82.8 years; 9.25% of GDP
- Spain – 82.8 years; 8.97% of GDP
- Iceland – 82.7 years; 8.29% of GDP
- Italy – 82.7 years; 8.94% of GDP
- Israel – 82.5 years; 7.31% of GDP
- Sweden – 82.4 years; 10.93% of GDP
- France – 82.4 years; 11.54% of GDP
- South Korea – 82.3 years; 7.34% of GDP
- Canada – 82.2 years; 10.53% of GDP
- Luxembourg – 82.0 years; 6.16% of GDP
- Netherlands – 81.9 years; 10.36% of GDP
- Norway – 81.8 years; 10.50% of GDP
- Malta – 81.7 years; 9.30% of GDP
- New Zealand – 81.6 years; 9.22% of GDP
- Austria – 81.5 years; 10.44% of GDP
- Ireland – 81.4 years; 7.38% of GDP
- United Kingdom – 81.2 years; 9.76% of GDP
- Belgium – 81.1 years; 10.04% of GDP
- Finland – 81.1 years; 9.49% of GDP
- Portugal – 81.1 years; 9.08% of GDP
- Germany – 81.0 years; 11.14% of GDP
- Greece – 81.0 years; 8.45% of GDP
- Slovenia – 80.8 years; 8.47% of GDP
- Denmark – 80.6 years; 10.35% of GDP
- Cyprus – 80.5 years; 6.88% of GDP
- Chile – 80.5 years; 8.53% of GDP
- Costa Rica – 79.6 years; 7.56% of GDP
Therefore, 19 out of the 30 countries with better life expectancies than the US spend below the world average on healthcare as a share of GDP with Singapore at just 4.47% of GDP getting by far the best value for money of any country. Moreover, most other countries are only spending fraction over the world average.
Finally the numbers for the United States look even worse when you consider that the latest Census Bureau figures show that 27.5 million Americans (more than the population of Australia) or 8.5% of the population lack any health insurance whatsoever.
What do you think? Please share your thoughts below and share this post with someone you think might find it interesting.
Excellent ! Would be good to continue this analysis and break out where the money is going. In particular, health insurance costs versus costs of actual delivery of health care. Kudos for including some basic measure of health outcome with the dollar figures. When discussing “health care”, at least in the US, I think it is always good to distinguish clearly between health insurance, health care delivery and actual health of the intended recipients. In the US, I think the expectation of receiving quality health care services is very high, plus most citizen still expect the health care system to deliver good health to them and many don’t take personal responsibility for their own health. And with all of the profit driven players in the health care insurance AND delivery industries, the results are sadly predictable. Question is: how long can the US economy sustain this situation ? Not much longer, I’m afraid.
Is this an atrocity?
Luxembourg’s health spending is affected by the fact that a large proportion of Luxembourg’s workforce lives outside the country, & commutes across the border to work. Their production is counted as part of Luxembourg’s GDP, but most of their spending & consumption takes place in Belgium, France or Germany. They & their families probably go to hospital, school, etc. where they live.
Ireland also has an inflated GDP, though much of it’s for different reasons. A lot of corporate profits are declared in Ireland, but not earned there. There are companies registered in Ireland & making large profits there, which count towards Ireland’s GDP, which may have only a nameplate on a lawyer’s or accountant’s wall & a bank account as their presence in the country. Others, such as Apple, have a real presence, but it only accounts for a tiny proportion of the company’s declared profits in Ireland. Most comes from products designed, made, & sold in other countries. In the mid-2010s a change in Apple’s internal accounting increased Ireland’s official GDP by over 10% – but almost none of that increase ever touched Ireland in any meaningful way. It passed through bank accounts registered in Ireland (but possibly hosted on servers elsewhere) – & that’s it.
Adjust the GDPs of Luxembourg & Ireland for those anomalies & their health spending as a share of GDP would increase considerably. Ireland’s central statistical office calculates, & publishes, an alternative measure (called Modified GNI, or GNI*) which it prefers for most purposes. ESA (the EU statistical office) has approved it for some EU purposes. Using it would increase health spending to close to the world average.
https://www.cso.ie/en/interactivezone/statisticsexplained/nationalaccountsexplained/modifiedgni/
1. Let the US negotiate and pay the average cost of prescription drugs that the world pays to drug companies.
2. Eliminate fraud in the medical industry with more severe penalties.
3. Eliminate waste.
4. Don’t compromise on the quality of care. Even if our life expectancy is lower it will rise.
5.Ridiculous to compare to countries with 3 million people like Ireland when we have 350 million people.
5. Don’t deprive illegal residents with healthcare but resolve the legal issues, fraud and waste.
This site is UK based.
Timecstamp is 5 hours in front of EST.